When you have a clean dataset in hand, run and visualise it !!!!
We all know that data cleaning isn’t the easiest task out there but we are blessed with internet and Internet is blessed with clean dataset to make every data enthusiast’s learning journey fun.
Let’s admit it, we all have been there where we just wait to visualise the data and that’s how I came across a Retail Dataset and I prepared a visualisation on Tableau.
I have learnt how to create bins for Age, use map, use measures and creating containers in the dashboard and I did the my favourite thing, put it all in a darker theme.
Visit my Tableau profile : Sonal’s Tableau Profile

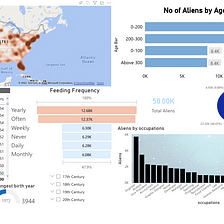
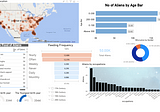
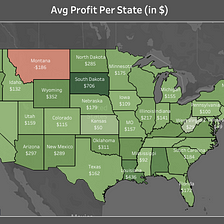
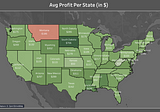
Recently I came across a challenge given by Ian Klosowicz. However the challenge is over and winner is announced but the data was so interesting it kept me engaged. I spent some-time analysing the data in sql and then Power-BI . This is not for the submission but for my learning
The data talks about Aliens in America, their living style, eating habits and interestingly job profile they work in, so maybe we all are alien in our own business sector (bad joke xD). So, I prepared the dashboard and I loved it while performing the data analysis about it and all through I learnt new tricks in Power-BI which helped in exploring Power BI a little more.

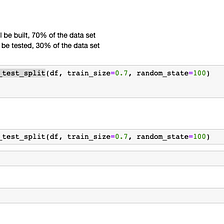
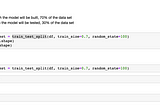


The requirement with the data set is to build a linear model to understand the demand dynamics of shared bikes. This article is divided into two parts , this par will help you in understanding the EDA part of the process, so let’s get started.
After performing the basic understanding, cleaning the dataset, we proceeded to perform the exploratory Data Analysis :
- Univariate Analysis
- Bivariate Analysis
- Multivariate Analysis
Univariate Analysis : It includes both categorical and numerical dataset. The graphs shared below are extracted from my python notebook which can be found here on github under repositories section ‘ML Models on Biker Dataset’.

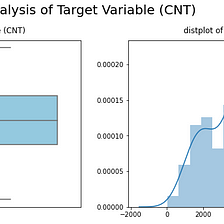
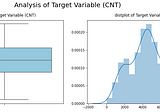
Data Inferences
- There exist no outliers in the target variable.
- The distribution is normal
- The distribution is normal